Chevron’s (CVX) Distributional Probability Curve Offers a Tempting Bullish Options Trade

Amid the backdrop of a challenged consumer economy and fading global demand, Chevron (CVX) and other major oil giants haven’t exactly enjoyed a stellar performance. Since the beginning of the year, CVX stock has gained less than 5%. Even with the admittedly robust dividend yield added, the total return comes out to only 9.4%.
In contrast, the benchmark S&P 500 has gained over 13% during the same frame. It’s no surprise, then, that even the options market appears to signal discontent over CVX stock. Still, the brewing skepticism could be the ideal environment for contrarians looking to extract big payouts from unexpected sources.
To be sure, though, the narrative will require plugging one’s nose at surface-level data. After the close on Monday, CVX stock represented one of the entries in Barchart’s list of unusual stock options volume; however, it wasn’t necessarily for encouraging reasons.
Total options volume landed at 25,731 contracts, representing a 13.87% decline from the one-month average. Call volume hit 17,016 contracts while put volume was 8,715 contracts. However, options flow data — which focuses exclusively on big block transactions — saw net trade sentiment drop to $760,700 below parity, thus firmly favoring the bears.
As it turned out, a large chunk of those calls were sold, with the largest trade being for $775,000 worth of premiums received for the sale of the $155 call expiring Nov. 21. Essentially, these high-level traders are underwriting the risk that CVX stock will not rise above the breakeven threshold.
If it does, the income receivers could then be forced to become payment providers — incurring the dreaded tail risk of credit-based transactions.
While it’s a risky proposition based on the current poor fundamentals of the oil market, there’s an argument to be made about taking the debit side of the Chevron trade.
Leveraging the Power of Data Science for CVX Stock
Let’s begin with an obvious point. Because the market features a constant struggle between bulls and bears, at the end of every session, there will always be a winner and a loser. Each transaction is inherently a zero-sum environment because (unless there is a mechanism where you can trade against yourself) by virtue of there being a trade, it means there is someone taking the opposite side.
Generally speaking, a blue-chip stock like Chevron will feature a 50/50 split in terms of expected profitability above a given starting point, with a slight upward bias. When plotted as a visual representation, the aforementioned probabilistic profile resembles a bell curve or a normal distribution. Essentially, every time you bet on CVX stock, you’re looking at a 51% or 52% success rate.
However, that’s the aggregated expected return across all price activities — and it’s a measurement unlikely to be witnessed consistently unless CVX stock is in homeostasis. Of course, that’s rarely the case. Big oil companies respond quite vigorously to broader economic conditions and global supply chain dynamics. These factors naturally influence CVX’s expected outcome.
Quantitatively, in the trailing 10 weeks, CVX stock has flashed an unusual 6-4-D signal: six up weeks, four down weeks, but with an overall downward trajectory. It’s a counterintuitive profile and thus represents only 7.16% of all identifiable sequences that the security has flashed since January 2019.
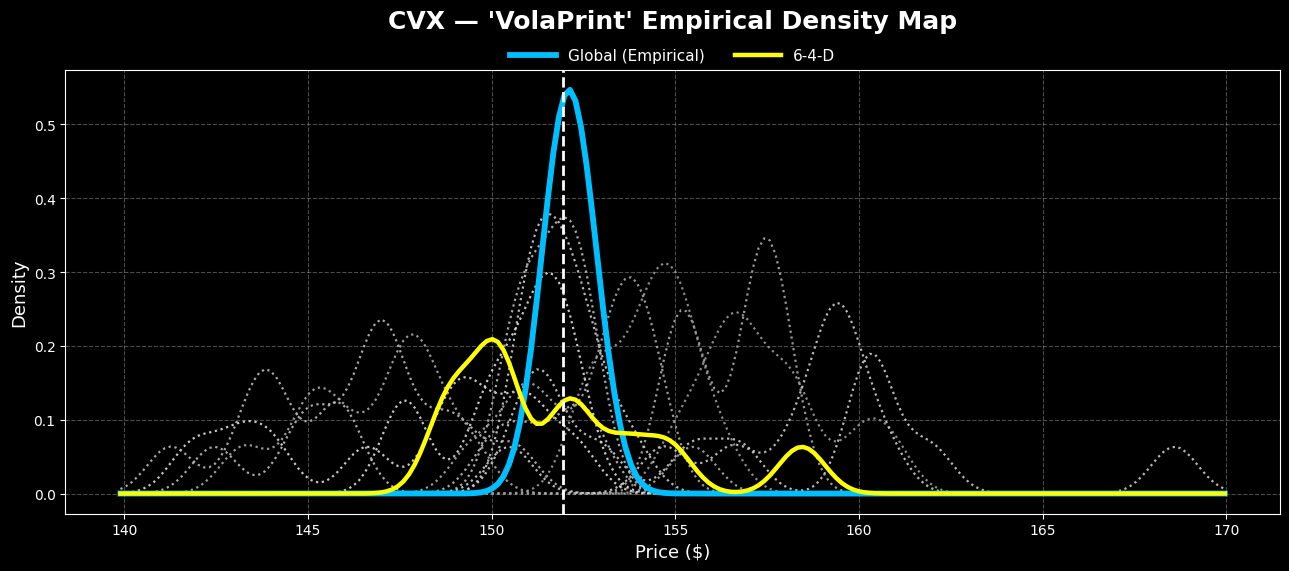
What’s fascinating, though, is that over the next 10 weeks, while CVX stock is expected to cluster most frequently around the $150 level, most of the outcomes tied to the 6-4-D sequence are projected to land above the anchor price of $151.94, which is Monday’s close. Further, by the tenth week, the “sequential” median price is projected to land at around $158.
In short, while the distributional curve of expected probabilities for CVX stock under baseline conditions resembles a standard bell curve, the bimodal distribution of the 6-4-D sequence is skewed north of the anchor.
As such, the framework mathematically favors a debit-based long trade.
A Potentially Mispriced Opportunity
Given the expected probabilistic landscape of CVX stock — assuming of course that the 6-4-D sequence represents the initial sentiment catalyst — the options trade that’s arguably the most tempting is the 155/160 bull call spread expiring Dec. 19. Basically, the trade requires CVX stock to rise through the second-leg strike price at expiration. That’s an aggressive proposition but the payout of nearly 154% is the siren call.
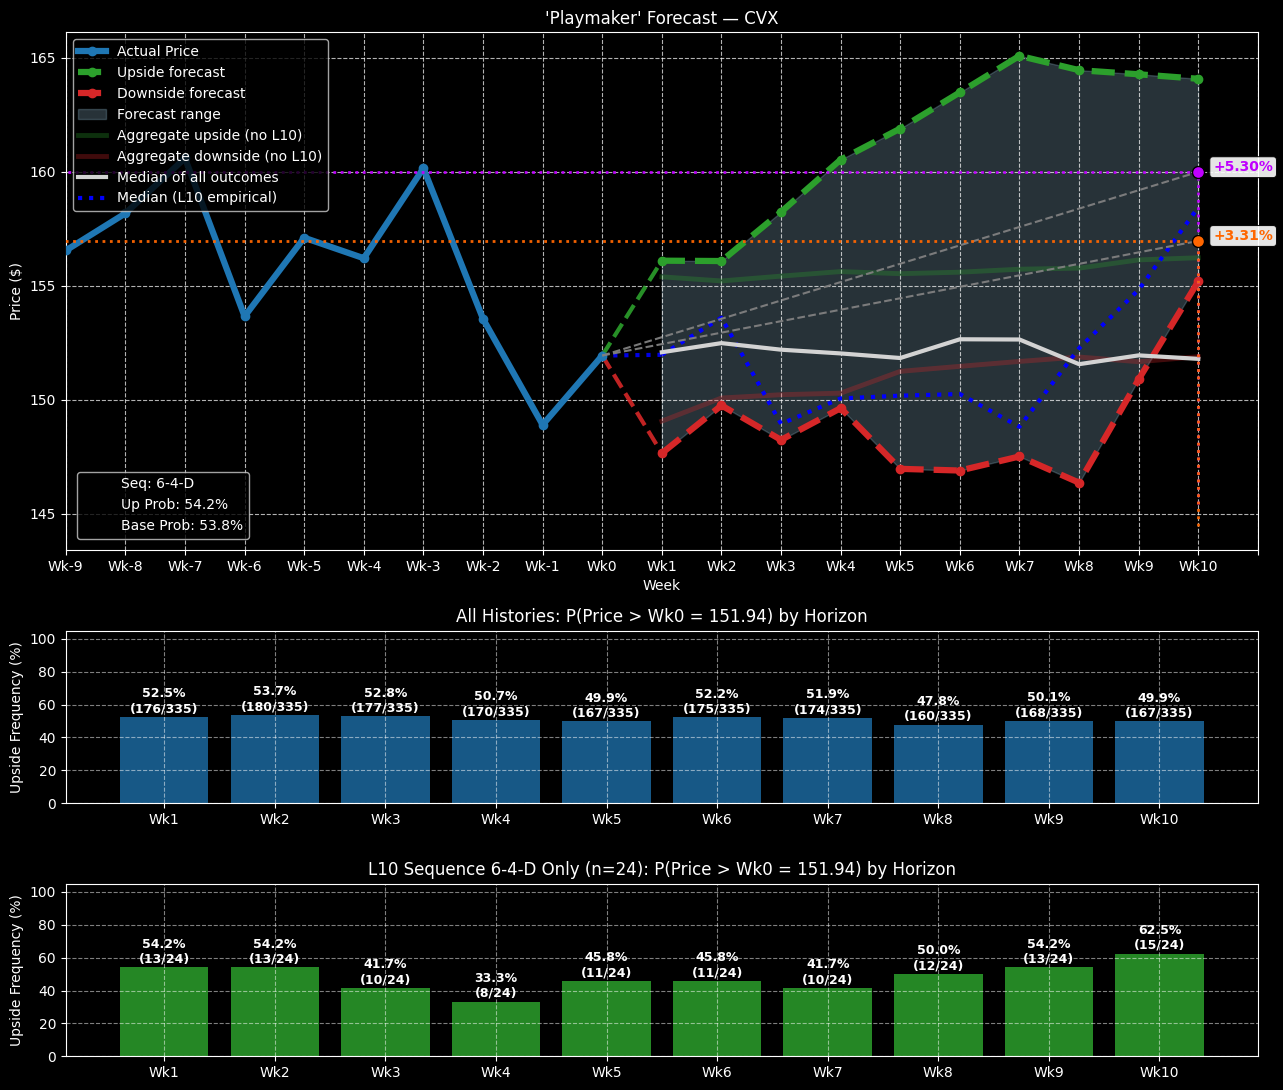
However, heeding the siren might not necessarily lead to destruction. That’s in part because the breakeven price comes in at $156.97. Sure, that’s 3.31% away from the current market price but it’s also well within reason based on past analogs tied to the 6-4-D sequence.
With a little bit of luck, the right catalyst can potentially push CVX stock above the psychologically significant $160 level. If you’re a quantitative trader, CVX stock may be boring but it could also offer a favorably mispriced opportunity.
On the date of publication, Josh Enomoto did not have (either directly or indirectly) positions in any of the securities mentioned in this article. All information and data in this article is solely for informational purposes. For more information please view the Barchart Disclosure Policy here.